No bookmark

SNOW PROFILES AND SNOWPACK TESTS

WHAT TAKING A LOOK AT THE SNOWPACK CAN REVEAL

Anyone out in the backcountry in winter has to deal with avalanche danger. There are many approaches to this. In addition to broad, general rules of conduct and algorithm-based methods, it is worth also taking a look directly at the snowpack. This can provide valuable information, e.g. if there is a weak layer, how easily it can be stressed and how well a crack can propagate in this weak layer. This information can be gained from snow profiles and using snowpack tests, for example the CT (compression test) or ECT (extended column test). THE CT primarily helps you find the weak layer and gives you an indication of the likelihood of release. THE ECT provides additional information about how well crack propagation works within the snowpack. 

This way, you can use your own observations in the field to evaluate how volatile the avalanche problem indicated in the avalanche bulletin really is. For persistent weak layers in particular, often the only thing that helps is a look at the snowpack. Because despite avalanche bulletins becoming more and more precise and naming even small-scale dangers in tour areas, the local danger on the individual slope can deviate significantly from the regional danger level.

CREATING A SNOW PROFILE

If the avalanche situation is unclear – as is generally the case with persistent weak layers – or the general danger level is significantly high, it’s worth taking a look at the snowpack. This requires a lot of knowledge and the right training. In an ideal situation, you would have both and would be able to see the big picture, understand processes within the snowpack and form your own picture of the snowpack situation. As always: Practice makes perfect. With the right equipment and some practice, a snowpack test takes no more than five minutes and is thus possible on any tour.

THE RIGHT WAY TO SET UP A SNOW PROFILE

A snow profile is only ever as good as its location, or in other words: It has to be representative of the terrain you require information about – so made on a slope with the same aspect, elevation and terrain features as the slopes avalanche bulletin has reported dangers on, or that you are traveling on. It’s no use making a profile in tracked terrain. 

There is a lot to be considered when carrying out and documenting a snow profile.

PROFILE LOCATION PREPARATION EQUIPMENT DOCUMENTING HARDNESS GRAIN FORMS EVALUATING

CRITERIA FOR CHOOSING A SNOW PROFILE LOCATION

Listed here in order of importance, the following five criteria apply when selecting a suitable location for a snow profile: 

  • The location of the profile should be representative, i.e. in the dangerous area named in the avalanche bulletin (unfavorable slope aspect) or in a location where information is required. 
  • Of course, the location of the profile should nevertheless not be dangerous, thus it should be either on flat terrain (less than 30° slope steepness) or on a comparatively small slope or above the dangerous area. 
  • The profile location should be “undisturbed”, i.e. it should not have any tracks or obstacles (e.g. rocks). 
  • The depth of the snow should be below average compared to the general snow situation. Weak layers are often more pronounced in areas with less snow and are more easily triggered. 
  • The slope should be uniform, i.e. the snowpack distribution should be consistent and it should not be located in undulating terrain – avalanches prefer uniform, regular slopes. 

The last two points can be checked using a probe. Often, not all criteria can be 100% fulfilled. The most important thing is that the slope is not dangerous and information can be gained from it.

PREPARATION AND WIDTH OF THE SNOW PROFILE

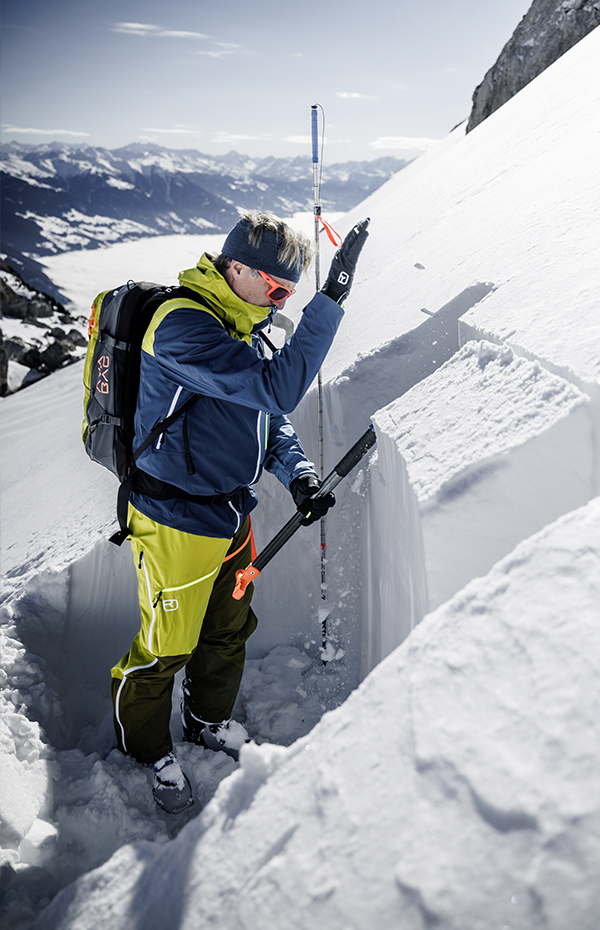
Use the probe to check whether the slope is uniform and the snow depth is below average. 

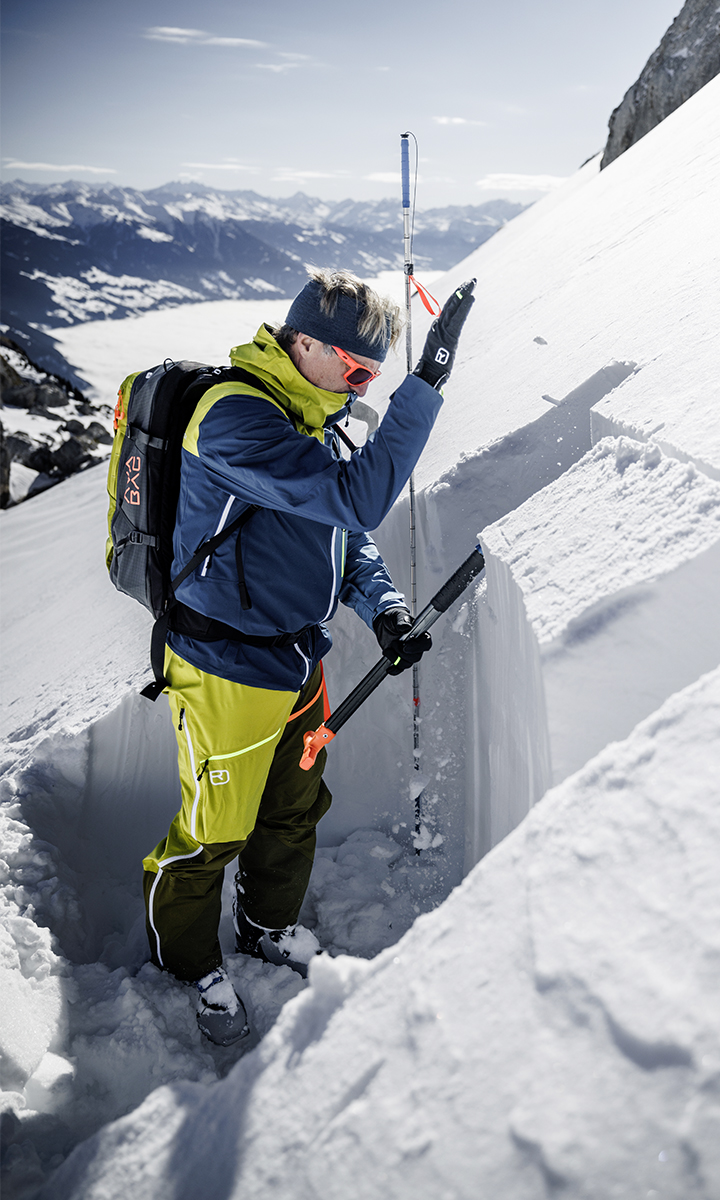
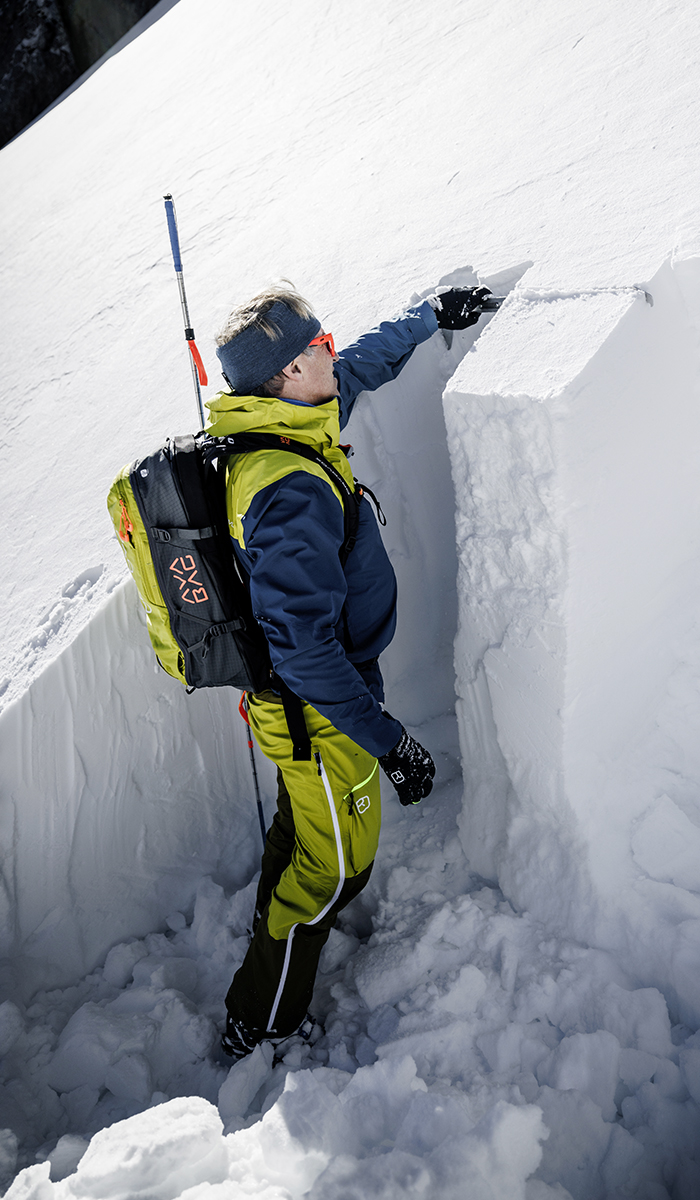
Then insert the probe vertically into one of the two corners of the planned profile wall, preferably into a corner that is facing the sun. Now you can begin digging the snow profile. 

If you want to carry out an ECT (extended column test), the profile needs to be at least 150 centimeters wide. For two tests – a CT (compression test) and an ECT – it should be 200 centimeters wide. 

The best place to test the profile is on the shaded part of the slope. Here, you can use the snow crystal card to observe the shapes, without them melting in the sun. 

EQUIPMENT 

To make a perfect snow profile you need a shovel and a probe, but also a saw, a crystal card, a stand magnifier, a snow thermometer and a notebook in which to record the results. 

A look at the snowpack can be more or less detailed, depending on your aim. Ideally, you would check the snowpack completely regarding grain forms, grain sizes, layer hardness and temperature and carry out a snowpack test. This will provide you with all of the important information, which you can later post online in the form of a detailed snow profile for other mountain athletes. However, this takes time. For this reason, profiles such as these are mostly carried out as part of a course or by people who are collecting profile data for avalanche bulletins and forwarding them to the relevant databases (e.g. www.lawis.at). 

Following the motto “looking at the snowpack is always better than not looking at the snowpack”, you can go ahead and carry out “just” a snowpack test. If the test reveals a weak layer, you can always take a closer look at it afterward. 

COLLECTING AND DOCUMENTING SNOW PROFILE DATA

To create a detailed snow profile, take the following steps: 

First, take a note of the general conditions, i.e. the exact time and location of the profile (GPS coordinates, date, height and slope aspect), the air temperature and the temperature at the snow surface (always in the shade, e.g. using the shovel blade as shade) as well as the wind direction, wind strength and weather (clouds, precipitation). 

Then use your fingers to check the snow hardness from top to bottom; this will enable you to quickly identify the main layers and the profile’s changes in hardness. Then examine the form and size of the grains, again from top to bottom. 

While doing so, measure the temperature every 10 centimeters. The probe in the shaded corner serves as a ruler. In between determining the grain forms, the temperature should be read and the thermometer then moved 10 centimeters down each time. 

The snow layers, with their grain forms, hardness and wetness, should be measured in centimeters from the ground. The probe in the corner of the profile serves as a ruler – probes with cm-markings are ideal for this. For example: With a snowpack depth of 136cm and a 6cm-thick surface crust layer, the description would be, e.g.: 136–130, crust, hardness: “knife”; grain form: “melt freeze crust”; grain size: 3–5mm; wetness: dry. The next layer could then be, e.g.: 130–111, hardness: “one finger”, rounded grains, 0.25–0.5mm, dry, etc.  

While one person is recording the date, the second person should note the values in a table in a notebook. Later, these values can be submitted line by line into the Austrian Avalanche Warning Services’ LAWIS database, which will create the familiar graphical image of a snow profile with changes in hardness, layer thicknesses, with information at the side about grain forms, grain sizes, etc. 

DETERMINING HARDNESS AND CHANGES IN HARDNESS

Hardness and changes in hardness are crucial. The hardness of each layer is determined using five hardness levels with intermediate levels. These are: 

  • Fist = when your fist can be pushed into the layer with little resistance. 
  • Four fingers = when your hand or four fingers can be pushed into the layer with little resistance. 
  • One finger = when one finger can be pushed into the layer with little resistance. 
  • Pencil = when a sharpened pencil can be pushed into the layer. 
  • Knife = when the snow is so compact that only a knife can be pushed into the layer. 

If you are unsure whether one or four fingers can be pushed into the snow, record both hardness levels. Because a classic slab avalanche is made of a relatively hard layer of snow on top of a soft, faceted weak layer, sudden jumps of two hardness levels or more between layers should ring alarm bells. Especially if the soft layer is in the top meter of the snowpack and the slab on top covers a large area.

DETERMINING GRAIN FORMS AND SIZES

Grain forms are significantly more difficult to identify than layer hardness. Here you need some experience, a good magnifier and a crystal size aid. Faceted crystals are, for example, generally larger than 0.5mm (typical weak layer), while small, round grain forms (typical of wind-drifted snow and slabs) are always smaller than 0.5mm. The crystal card helps determine whether the grain size is between 0.25 and 0.5mm (= rounded grains) or whether the grains are larger, e.g. 1–3mm. In the latter case, these can only be faceted crystals or melt forms. Melt forms are rounded and often “stick” together; faceted crystals are similar to sugar and have straight edges. 

Significant differences in grain size are a warning sign, especially if small, compactly layered crystals (a slab) are lying on large, faceted, non-cohesive crystals (a weak layer) – the perfect prerequisites for a snow slab. 

READING AND EVALUATING A SNOW PROFILE

The greater the difference between layers, the more unfavorable the profile, e.g. hard on soft; small on large crystals; small, rounded crystals on faceted. The more layers there are within a profile, the more likely that you will find a weak layer. And if this weak layer can also be “stressed”, i.e. it can still be “reached” by a winter athlete, the situation is even more precarious. One way to measure this is by the sinking depth. Generally speaking, a compact slab with a hardness that allows for crack propagation, but is also not so hard that the winter athlete cannot sink through to the weak layer, should be classed as precarious. 

The rule for the weak layer is: the softer it is, the closer it is to the surface and the larger the crystals within it and the more precarious it is. However, the thickness of the weak layer does not matter. A common feature is that faceted weak layers are often found under or above a thin layer of ice or crusted snow and can be just a few millimeters thick, which means they are tricky to detect.  

A snowpack test will quickly identify the precarious layer. Therefore, experts often work in reverse: First they do a snowpack test (to identify the weak layer), then they take a closer look at the layer to understand how it could have formed so that they can then consider where this layer could or must be found elsewhere in the mountains. This transfer and interpretation of the results is known as “process thinking”. You try to imagine where this weak layer must have formed and where a slab will be lying on top, and use this information to predict where dangers can be expected in the mountains.

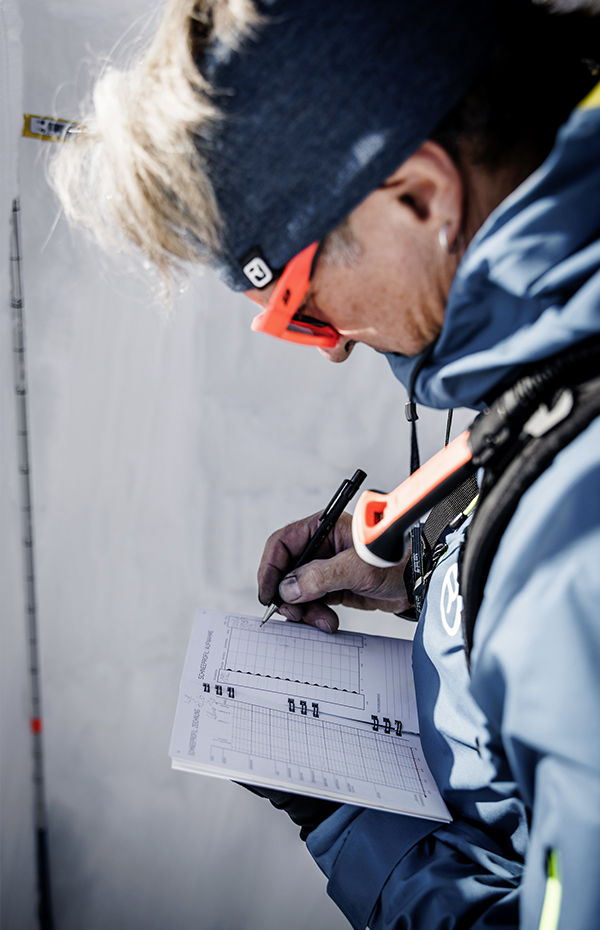
With the help of a template, known as a snow profile chart, you can quickly document the profile data in an organized way. In order to create a clear overview of the snowpack at the end, you can transfer your collected data into a snow profile program such as the Austrian Avalanche Warning Services’ LAWIS database (www.lawis.at) when you get home. There, the data is organized into a snow profile graph and made freely available online so that other winter athletes can include this important information in their tour plans. The following information is included in the snow profile chart:

1
2
3
4
5
6
7
8
9

With the help of a template, known as a snow profile chart, you can quickly document the profile data in an organized way. In order to create a clear overview of the snowpack at the end, you can transfer your collected data into a snow profile program such as the Austrian Avalanche Warning Services’ LAWIS database (www.lawis.at) when you get home. There, the data is organized into a snow profile graph and made freely available online so that other winter athletes can include this important information in their tour plans. The following information is included in the snow profile chart:

1
Time and location
2
Aspect and elevation
3
Weather conditions
4
Snow temperature (x axis)
5
Snow depth (y-depth)
6
Hardness
7
Temperature graph
8
Snow depth graph
9
Indication of a weak layer

It is important to provide an exact location using GPS coordinates and the time at which the snow profile was created – only then can it be properly attributed. Old profiles, e.g. before a snowfall or a long period of wind, are less helpful for assessing the current situation.

Together with the terrain features (map), the aspect and elevation tell you where else you can expect a similar snowpack structure.

The weather conditions provide information about the temperature, wind and precipitation at the specific location at the time the profile was created.

In combination with the aspect and time of day, the temperature at the snow surface (x-axis) tells you whether water has penetrated the surface of the snowpack or if it remains dry, and also what effect radiation is having and whether the surface will undergo faceting metamorphism. 

The snow depth, position of the weak layers and the thickness of the slab can all be derived from the y-axis.

Snow hardness determines the sinking depth, snow quality and characteristics of the slab – the harder it is, the more easily it expands, but the more difficult it is to trigger. 

The temperature graph can be used to extrapolate processes within the snowpack, e.g. whether there is a steep temperature gradient, which would encourage faceting (the formation of weak layers on thin crusts, the formation of a surface weak layer that could later become precarious, etc.). A flatter temperature gradient suggests a diminishing metamorphism in the snowpack. If the snowpack is already isothermal, meaning that it is the same temperature (between -2°C and 0°C) all the way through, you can expect a wet snow problem.

This graph provides information about the depth of the snowpack and the distribution of the layers. 

Snowpack tests are illustrated to the right of the profile; abbreviations provide information about initiation and, in the event of an ECT, about the shear surface or propagation behavior.  

ECTP 5@56 means, for example, that the crack suddenly and extensively propagated with the fifth wrist tap in the weak layer at a height of 56cm – a very precarious result.

SYMBOLS AND DESCRIPTIONS IN THE SNOW PROFILE

When you read a standard snow profile, you will be confronted with very much specialist terminology and symbols. The good news: It’s less complicated than it seems at first glance. Because all of the profiles in the LAWIS database employed by the Austrian Avalanche Warning Services and similar organizations use the same symbols for snow grains and crystals and uniform descriptions of hardness and grain size.  

However, interpreting a snow profile requires a great deal of knowledge and experience. There are interpretation aids to help you correctly estimate snowpack stability.

SYMBOLS AND DESCRIPTIONS IN THE SNOW PROFILE

When you read a standard snow profile, you will be confronted with very much specialist terminology and symbols. The good news: It’s less complicated than it seems at first glance. Because all of the profiles in the LAWIS database employed by the Austrian Avalanche Warning Services and similar organizations use the same symbols for snow grains and crystals and uniform descriptions of hardness and grain size.

SYMBOLS AND DESCRIPTIONS IN THE SNOW PROFILE

Precipitation particles (new snow) US

Typical size 1–4mm. A snowflake consists of several new snow crystals that are hooked into each other; always found on the snow surface. Quickly become decomposing and fragmented precipitation particles.

Melt forms US

Typical size 0.5–3mm. Often damp, often frozen to the crust.

Decomposing and fragmented precipitation particles US

Typical size 1–2mm. Often, new snow is broken down into smaller pieces by the wind and becomes fragmented. Also as an intermediate stage between precipitation particles and rounded grains as a result of rounding.

Melt freeze crust US

Typical size 0.5–3mm. A crust made of melt forms that have frozen together. The crust is most often formed by heat. But it can also be formed by wind (wind crust). In this case it will not consist of melt forms, but of small, rounded crystals.

Rounded grains US

Typical size 0.25–0.5mm. The smallest crystal in the snowpack and, therefore, compact and closely packed. The typical crystal form found in snow slabs.

Ice formations US

No individual grains recognizable, a crust created in the snowpack by frozen rain or freezing melt water.

Faceted crystals US

Typical size 0.5–3mm. Mostly dry, the form of kinetic metamorphism and the typical crystal form in weak layers. Faceted crystals often form above or below crusts.

Rounding faceted particles US

Typical size 0.5–3mm. Faceted crystals are melted by heat, rounding the facets.

Depth hoar US

Typical size 1.75–5mm. Often found close to the ground; strongly faceted crystals that form hexagonal, graduated cups in their final step.

Graupel US

Typical size 1–4mm. A form of precipitation, graupel grains can form a weak layer; however, it “heals” quite quickly and is rarely spread over a large area.

Surface hoar US

Typical size 1–40mm. The sublimation of the cold snow surface causes “ice plates” to form. However, these are quickly destroyed by wind or the sun’s radiation. If covered in snow, they can serve as an excellent weak layer that can stay for quite a long time.

Fist US

with your fist, which can be pushed into the layer with little resistance.

4 fingers US

with four fingers, which can be pushed into the layer with little resistance.

One finger US

with one finger, which can be pushed into the layer with little resistance.

Pencil US

with a (sharpened) pencil, which can be pushed into the layer.

Knife US

only a knife can be pushed into the compact layer.

Precipitation particles (new snow) US
Melt forms US
Decomposing and fragmented precipitation particles US
Melt freeze crust US
Rounded grains US
Ice formations US
Faceted crystals US
Rounding faceted particles US
Depth hoar US
Graupel US
Surface hoar US
Fist US
4 fingers US
One finger US
Pencil US
Knife US

LAWIS DATABASE

The Austrian Avalanche Warning Services’ LAWIS database contains numerous snow profiles that are freely available. Here, you can upload and publish your own snow profile via the user interface. 

You can download a matching template here.

SNOW PROFILES – AN IMPORTANT BASIS FOR THE AVALANCHE BULLETIN  

Snow profiles and snowpack tests provide information that is very important for the avalanche bulletin. They provide indications of whether and where weak layers can be found, how easy these are to disturb (probability of release) and how the crack propagation situation is. Different kinds of information can be derived depending upon the test. It is important to note that a snowpack test always provides local information. Each test is only ever as good as your choice of location. Each test has to be correctly transferred to the right areas using “process thinking” (interpretation for other areas).

Snow profiles and snowpack tests are not easy, but they are the only qualitative way to gather information about the snowpack structure. In addition to weather information and feedback about avalanche releases, these form the most important basis for all avalanche warning service assessments. If, regardless of the general conduct recommendations and rigid algorithms, you want or have to do your own snowpack assessment (e.g. in areas with poor avalanche bulletin quality or with no avalanche bulletin), you must concern yourself with the analysis of the snowpack.

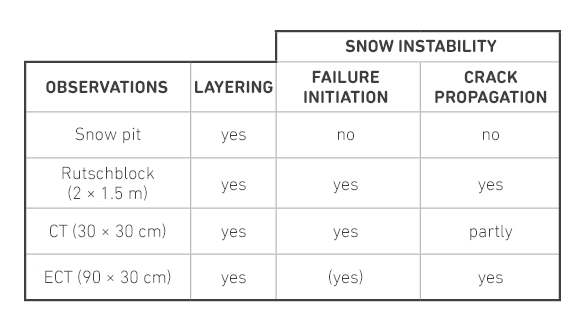
The following overview provides information about the opportunities for interpretation provided by the various snowpack tests, i.e. what you can deduce from them regarding snowpack stability:

To do this, all of the Avalanche Warning services work with the ECT, the extended column test, although the Swiss services also work with the traditional but time-intensive rutschblock test. The Bavarian Avalanche Warning Services are the only ones to work with the “small block test”, a variation of the CT. Different types of information can be gained depending upon which snowpack test is  done. In principle, snowpack tests can help you establish whether weak layers are present and, if so, where they can be found, how “stable” the snowpack is (i.e. how easy it is to disturb or trigger), and how well a crack can propagate. 

ECT ECT ECT

EXTENDED COLUMN TEST (ECT) – THE STANDARD TEST

The ECT is the standard test and is, therefore, used for almost all avalanche bulletins. The reason: Firstly, it can be carried out with relatively little effort; secondly, it provides you with the answers to the three core questions regarding the snowpack. These are: 

  1. Is there a weak layer and, if so, where can it be found in the snowpack?
  2. How easily can it be disturbed (probability of release)?
  3. How well can a crack in the weak layer propagate?

Because an ECT only takes around 5 to 10 minutes, you can carry out several tests at the aspects and elevations you are interested in. This way, field testers or “reporters” can provide the avalanche bulletins with important, extensive information. 

TEST LOCATION PREPARATION WIDTH CUTTING LOADING TEST NOTATION INTERPRETATION

THE PERFECT LOCATION FOR A SNOW PROFILE

Each test is  only ever as good as the location of the profile!

  1. The location should be relevant (unfavorable slope aspect, i.e. where dangerous areas are suspected). 

  2. The location should not be dangerous, but should still be relevant. Preferably, you should stay under 30° or limit yourself to very small slopes and remain above the dangerous area. 

  3. The profile location should be undisturbed, i.e. it should not have any tracks or obstacles (e.g. rocks). 

  4. The depth of the snow should be below average compared to the general snow situation. Because weak layers are often more pronounced in areas with less snow, and are easier to initiate. 

  5. The slope should be uniform, i.e. the snowpack distribution should be consistent and it should not be located in undulating terrain – avalanches prefer uniform, regular slopes.

PREPARING FOR A SNOW PROFILE

It is very important  to choose a suitable location. It has to be representative but also fulfil all of the requirements listed above.  

First, use the probe to check how thick the snowpack is and whether it is as evenly distributed as possible (uniform) at the chosen location. 

Then the probe is inserted vertically into the shaded corner of the planned profile wall. Now you can start digging it out.

SNOW PROFILE WIDTH

For an ECT to be done,  the profile must be at least 150cm wide. If you want to carry out two tests, e.g. a CT and an ECT, the profile should be 200 centimeters wide. 

The best place to test the profile is on the shaded part of the slope. Here, you can use the snow crystal card to observe the shapes, without them melting in the sun. Tests are conducted on the front face of the profile wall.

CUTTING THE BLOCK 

The dimensions of the block to be cut for an ECT are: 30cm deep and 90cm wide. 

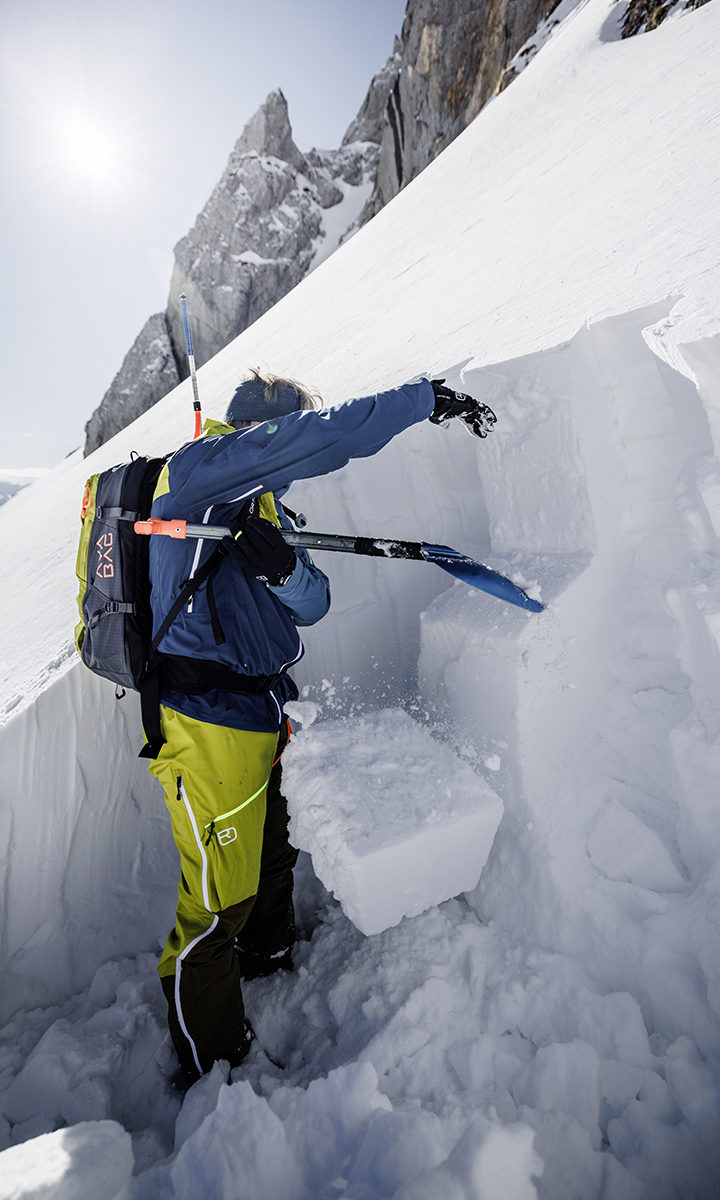
First, the front face is cut out vertically and the dimensions drawn on the surface of the snow. Now begin freeing the sides. This is best done with a snow saw. Saw vertically into the snow twice at an interval of 20 to 30cm and clear out the snow from the 20 to 30cm block using a shovel. Then do the same on the other side. The two ditches to the right and left of the freed block should be cut 20 to 30cm deeper than the block itself so that you can later saw the back of the block free. 

The back of the block can only be sawed with a long enough saw, preferably one that is relatively rigid and at least 50cm long. First you saw the back of the block from the top, then along the cutting surface down the whole height of the block from the ditches to the left and the right. Alternatively a cord or cable saw could be used to do this by running it around two probes stuck into the respective corners. In this case, the probes must be held in place by a third person while the other two do the sawing.

LOADING TEST

Once the block has been cut free, you can start with the actual testing. To do this, the shovel blade is placed on the left or right end of the block and loaded. The shovel is loaded in three stages by tapping it with the flat of your hand and later with your fist. You continue adding load until either a full or partial break forms. As you do so, the shovel blade will sink deeper and deeper into the snow. It helps if one person taps and the other observes closely if and when a crack forms. Because if you are on flat terrain a crack is easy to miss, as slabs on slopes less than 30° cannot slide. The best thing is for the observer to film the test using a cell phone. 

The first 10 “taps” are from the wrist; the way to do this is to allow the hand to “drop” from the wrist without applying any extra force – the load at this stage is very low. Then the lower arm is allowed to drop from the elbow 10 times. Finally, you allow your whole arm to drop from the shoulder 10 times and the “hit” is done with your fist.

LOADING STEPS, CRACK TYPES AND NOTATION

Once the block has been cut free, load is added to it step by step at one of the two sides. It is important to identify when and whether the crack propagates to the end of the block. A video can help you do this. 

The results are recorded and the shear surface examined and interpreted. The test result is noted as follows:

LOADING STEPS

Crack when digging / cutting #0 
Crack when tapping from the wrist #1–10 
Crack when tapping from the elbow #11–20 
Crack when tapping from the shoulder #21–30

TYPE OF CRACK

  • Propagation – P – the crack propagates through the entire block at tap # or the following tap. # is the tap at which the crack forms. 

  • No propagation – N – the crack forms at tap # and does not propagate throughout the entire block with the next tap (partial crack). 

  • No crack – X – no flat shear surfaces form by the end of the test. 

NOTATION

The results are noted in the following way and order: 

First comes the abbreviation “ECT”, followed immediately by the type of crack (P/N/X), then the loading step (between #0 and #30) and then – after an @ – the layer in the profile in which the crack formed. 

Examples: 

  • With the 5th tap, a crack forms in the layer located 36cm up in the profile, and then propagates throughout the entire block: ECTP 5@36cm 
  • A crack forms in the layer located 75cm up in the profile with the 24th tap and then propagates throughout the entire block with the 25th tap: ECTP 24@75cm 
  • With the 27th tap, a crack forms in the layer located 12cm up in the profile, but does not completely propagate by the end of the test (partial crack, the block only cracks under the shovel but cannot propagate): ECTN 27@12cm 
  • A crack forms in the layer located 63cm up in the profile when sawing: ECTP 0@63cm 
  • No large cracks at any loading step: ECTX 

INTERPRETING THE TEST RESULTS

The force of the tap and the loading steps give you a rough indication of how easily a weak layer can be stressed. If the crack forms in less than 14 taps, the weak layer  is unstable, between 14 and 18 taps it is moderate and in 19 taps or more it is relatively difficult to initiate. But beware! If the slab is thinner or softer in another area, the weak layer could possibly be disturbed much sooner! Therefore, the force of the tap is not the determining criterion. Much more significant are the type of crack and how smooth the shear surface is. If a crack forms suddenly across the entire surface of the block and the shear surface is smooth, it is a sign that you must expect the release of a snow slab at the corresponding point.  

If the shear surface is smooth and the crack has propagated throughout the entire block with just one tap and the block can be observed to simultaneously “sink” (collapse of the weak layer), this indicates optimal interplay between the slab and the weak layer, suggesting that the snow slab will very probably propagate. In this case, the corresponding slope aspects and elevations should be treated with extreme caution. 

The following is an aid for interpreting the results:

CT CT CT

COMPRESSION TEST (CT) – THE QUICK TEST 

Unlike its big brother, the ECT, the compression test can be carried out very quickly. It provides information about whether a weak layer can be found in the snowpack and, if so, where. As with the ECT, the loading step will provide a rough indication of the probability of release. However, the CT does not provide information about crack propagation. To a limited extent, this can be interpreted by looking at the shear surface.

WIDTH LOADING STEPS NOTATION INTERPRETATION

SNOW PROFILE WIDTH

If a CT is the only test being done, a profile width of one meter is enough.
The dimensions for the column  that needs to be cut out for a CT are: 30cm deep and 30cm wide. 

First, the front face is cut out vertically and the dimensions drawn on the surface of the snow. Now begin freeing the sides. This is best done with a snow saw. Saw vertically into the snow at an interval of 20 to 30cm and clear out the snow from the 20 to 30cm block using a shovel. This creates a 20 to 30cm ditch to the left and  right of the column, and which should be cut around 20 to 30cm deeper than the height of the column (at least 1 meter). Finally, the back wall is cut free. 

This is done using a long enough saw (50cm). Stand in the ditch and saw the back wall of the column from top to bottom.

LOADING STEPS AND CRACK TYPES

Once the block has been cut free, load is added to it step by step, as in the ECT. It is important to discern if and when the crack will propagate. A video can help you do this. The results are recorded and the shear surface examined and interpreted. The test result is noted as follows:

LOADING STEPS

Crack when digging / cutting #0 
Crack when tapping from the wrist #1–10 
Crack when tapping from the elbow #11–20 
Crack when tapping from the shoulder #21–30 

TYPE OF CRACK

  • Sudden, smooth crack (P – planar) – a smooth crack forms at tap # or with the next tap. # is the tap at which the crack forms. 

  • Partial crack or irregular shear surface (R – resistant) – crack forms at tap #, but the crack surface is irregular rather than smooth or the crack only propagates through the column on several taps. 

  • No crack (B) – no flat shear surfaces form by the end of the test, the block “crumbles”. 

NOTATION 

The results are noted in the following way and order: 

First comes the abbreviation “CT”, followed by the loading step (between #0 and #30) and then – after an @ – the layer in the profile in which the crack formed. A description of the crack surface is added at the end. 

Examples: 

  • With the 5th tap, a sudden smooth crack forms in the layer located 36cm up in the profile: CT 5@36 P 
  • A crack forms in the layer located 75cm up in the profile with the 24th tap; however, the crack is not sudden and is clearly irregular: CT 24@75 R 
  • A crack forms in the layer located 63cm up in the profile when sawing: CT 0@63 P 
  • No large cracks at any loading step: CT 31 or CT 30@ B

INTERPRETING THE TEST RESULTS

As with an ECT, a CT must be interpreted correctly. The compression test  provides an indication of initiation and crack propagation. However, crack propagation during a CT is of limited significance because the block or column is very small and is directly underneath the loaded area (shovel blade). The following is an aid for interpreting the results:

Naturschutz Naturschutz Naturschutz

NATURE-FRIENDLY SKI TOURING

KEEPING AN EYE ON YOUR OWN FOOTPRINT

All ski tourers and freeriders who go out into the backcountry leave tracks behind them. As outdoor athletes who passionately “consume” nature and the mountains, our goal must be to keep our footprint as small as possible. This means taking environmental responsibility for our tours, being mindful in the mountains. 

Nature-friendly ski touring begins in the tour planning stage at home. Choose a tour area that requires a shorter journey to get to, create a carpool, travel using public transport or by bike, avoid high-traffic, fashionable tours or forgo a tour altogether – all of these are effective measures for protecting nature. In the mountains it is important to respect conservation zones, avoid young trees, keep far away from wildlife feeding areas and, of course, leave no trash behind. By changing our behavior, we have the power to make a big difference.

PROTACT ACADEMY LAB 

There are many ways to make ski touring more nature-friendly. Our PROTACT ACADEMY LAB  offers tips, tricks and tools to help you reduce your footprint in the mountains.

SAFETY ACADEMY - AVALANCHE COURSES

When you go off -piste and onto unsecured terrain, you need in-depth knowledge about how to reduce risks and perform an avalanche victim search.

Secure a place on a course and get yourself prepared for an emergency.

TOUR AND TRAINING BASIC

AIARE Avalanche Level 1

In our “Basic Training & Touring” course, our state-certified mountain guides will teach you not only how to use avalanche equipment so that you can handle a companion rescue after an avalanche, but also the essentials of sensible tour planning and how to translate your tour plan to the terrain.

VIEW COURSE DETAILS

TOUR AND TRAINING ADVANCED

BASICS FOR STAYING SAFE IN DEEP SNOW (3 DAYS)

The “Advanced Training & Touring” avalanche course runs over 3 days and is ideal for freeriders and ski tourers who are already familiar with their avalanche equipment (how to use emergency equipment and simple search strategies), have already gained experience in the backcountry and wish to deepen their basic knowledge.

VIEW COURSE DETAILS
NEXT CHAPTER

RESCUING A COMPANION, FIRST AID & PROFESSIONAL RESCUE

In an ideal situation, you would identify and avoid terrain at risk of an avalanche from the start. If an avalanche nevertheless occurs, all participants must know exactly what to do and act quickly. Chapter four takes a detailed look at all the aspects of avalanche rescue – from companion rescue including an emergency call, avalanche transceiver search, probing and shoveling, through to first aid and professional rescue services.

Next chapter